USMC85 · Visualising
Table of contents
USMC85 - 4. Visualising
EXERCISE - Drawing a map
Draw the map of the ground floor of Cnam Conté (10min). Discuss the produced maps.
Visualising
Introduction
Visualisation is any technique for creating images, diagrams, or animations to communicate a message. Visualization through visual imagery has been an effective way to communicate both abstract and concrete ideas since the dawn of humanity (wikipedia).
Why visualise? Anscombe’s quartet
The four datasets below have the same mean, variance, correlation and regression line - yet they tell four different stories. Summary statistics hide what a plot shows at once (Anscombe, 1973). The Datasaurus Dozen pushes the point further: twelve datasets with identical statistics, one of which is a dinosaur (Matejka & Fitzmaurice, 2017).

Examples
-
Cartography: The Ptolemy world map, reconstituted from Ptolemy’s Geographia (circa 150) (source: wikipedia)

-
History: John Snow’s cholera map of London, 1854 - the map as evidence (source: wikipedia)

-
History: Florence Nightingale’s rose diagram on the causes of mortality in the Crimean War, 1858 - the chart as an argument for reform (source: wikipedia)

-
History: Charles Minard’s information graphic of Napoleon’s march, 1869 - six variables on one page (source: wikipedia)

-
History: W.E.B. Du Bois, plate from The Georgia Negro, Paris Exposition 1900 - a spiral chart of household furniture value, 1875-1899 (source: Library of Congress)

-
Socio-economy: Petroleum flow, a Sankey diagram of petroleum in our daily lives - see it among the Sankey diagram examples on datavizproject.com
-
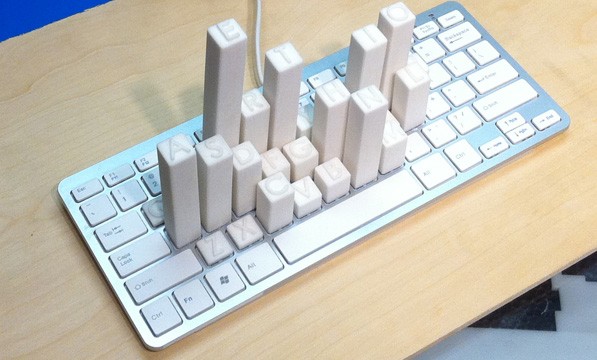
Physical dataviz: Keyboard Frequency Sculpture (source: https://dataphys.org)
-
Science: Cortex Man - Sensory Model & Motor Model - the body redrawn in proportion to its brain area (source: https://www.threeding.com)


Considerations
- Know your audience and the aim of your communication - This will impact every aspect of the visualisation
- Tell a story
- Keep your visualisations simple and digestible
Visualisation is rhetoric
A visual persuades as much as a text does, and the rhetorical triangle of the Rhetoric session applies to it (Kostelnick & Roberts, 2011):
- Logos - the data and the way it is encoded: the right form, an honest scale, a clear reading order.
- Ethos - credibility: sources stated, units and axes labelled, technical quality. One sloppy or misleading chart costs the trust of the whole work.
- Pathos - colour, images, human scale (“enough to fill 3 Olympic pools”). Legitimate when it serves the message, manipulative when it replaces the evidence.
- Kairos - the right visual for the moment and the medium: a slide seen for 30 seconds is not a poster read for 5 minutes, nor a figure studied in a paper.
How we see
Preattentive attributes
Some visual differences are detected in a fraction of a second, before conscious attention: colour (hue), intensity, size, orientation, shape, enclosure, position (Healey & Enns, 2012; Ware, 2008). Use them to make the important element pop out - and use only one or two at a time, otherwise nothing pops out any more.
EXERCISE - Count the 3s (30 seconds each)
How many 3s are there?
75893215946027538461029387456
20396874561230984572613094875
86547209371856203947563820156
Now try again:
75893215946027538461029387456 20396874561230984572613094875 86547209371856203947563820156
Same digits, same count (9) - only the contrast changed.
Visual variables
Jacques Bertin (1967), a French cartographer, listed the variables a mark can use to carry information. They are not equal: each suits a type of data.
| Variable | Good for | Example |
|---|---|---|
| Position | everything - the most accurate | dots on a scatter plot |
| Size (length, area) | quantities | bar length, bubble area |
| Value (light-dark) | ordered data | light-to-dark map of density |
| Colour (hue) | categories, not quantities | one hue per network type |
| Orientation | categories, direction | arrows, hatching |
| Shape | categories (few) | circle = node, square = gateway |
| Texture | categories, print in black and white | hatched vs plain areas |
Gestalt principles
The eye groups elements before it reads them. Use these principles to show what belongs together:
- Proximity - close elements are read as a group
- Similarity - elements of the same colour, shape or size are read as related
- Enclosure - a frame or a background shade creates a group
- Connection - a line linking two elements relates them more strongly than colour or proximity
- Continuity - the eye follows lines and curves; align elements along a path
- Closure - the eye completes incomplete shapes, so a chart rarely needs a heavy border
Choosing the right form
Human perception ranks encodings by accuracy: position > length > angle > area > colour (Cleveland & McGill, 1984) - prefer the leftmost encoding your data allows. This is why a bar chart usually beats a pie chart, and a pie chart beats a bubble chart.
Data charts answer how much: comparison (bars), change over time (line), part-to-whole (stacked bar), distribution (histogram, box plot), relationship (scatter plot).
Concept diagrams answer how it works. Engineers draw them more often than charts:
| Message | Diagram | Rule |
|---|---|---|
| Steps in sequence | flowchart, swimlane | one reading direction (left-right or top-down) |
| Parts of a system | block diagram, layered stack | same level = same size and alignment |
| Relations between elements | node-link (network) diagram | few crossing lines; highlight the path that matters |
| Hierarchy | tree | the root at the top or on the left |
| Events in time | timeline | a real time scale, or say clearly that it isn’t one |
| Comparison of options | table, small multiples | same axes and scales everywhere |
Sometimes a table is better. When the reader needs exact values or will look up individual numbers, a well-designed table beats any chart (Few, 2012).
Sketch first. Draw several options on paper before opening a tool: in 10 minutes you can compare five layouts, whereas software pushes you towards its defaults. Giorgia Lupi and Stefanie Posavec’s Dear Data postcards show how far hand-drawn visualisation can go (Lupi & Posavec, 2016).
Words in the visual
- The title states the takeaway. “Each relay node extends the network’s range” says more than “Network range”.
- Label directly. Put labels next to the lines or bars they name; a legend forces the eye to travel back and forth.
- Annotate the insight. One arrow or one sentence pointing at the key point (“the outage starts here”) does more than a paragraph of explanation.
- Remove what doesn’t speak. Gridlines, borders, 3D effects, decimals nobody needs (Knaflic, 2015).
- Name your sources in small print, at the bottom.
Structural elements
Visual design principles: CARP
The four foundational principles of visual design (Williams, 2014):
| Principle | Rule | How |
|---|---|---|
| C - Contrast | If two items are different, make them very different. | Size, colour, weight and shape create hierarchy (e.g. title 24 pt bold vs body 12 pt regular). Avoid timid differences that look like mistakes. |
| A - Alignment | Nothing should be placed arbitrarily. | Every element connects visually to something else: edges, centres, consistent margins. |
| R - Repetition | Repeat visual elements throughout the design. | Consistent colours, fonts, shapes and spacing create unity and help the audience recognise patterns. |
| P - Proximity | Group related items together. | Physical closeness implies relationship; white space separates unrelated items. |
Quick test: Squint at your visual. Can you still see the structure and hierarchy? If yes, CARP is working.
Visualisation focuses on purpose, clarity, inviting and effective communication of data. Key principles include:
- Have a clear purpose for your visualisation that aligns with the message you want to convey and the way you want the audience to receive your message. Tailoring visuals to the specific audience ensures comprehension and impact.
- Choose the right visualisation type based on the structure and nature of your data. For example, use Sankey diagrams to show flows, radar charts for comparing variables, waterfall charts for running totals, and Gantt charts for timelines. Select charts that accurately represent the story without clutter.
- Maintain consistency across the entire work to avoid confusion.
- Use predictable layout patterns for an obvious reading flow, so viewers are guided through the story.
- Avoid clutter, unnecessary decoration (aka chartjunk), and overly complex visuals. Keep designs simple and focused on communicating the essential information.
- If you design a dashboard, limit the number of visualisations (3-4 recommended) to aid understanding and engagement. Group related filters or controls and make the dashboard visually attractive and easy to navigate.
- Apply colour intentionally and strategically. Use colour to highlight key information and create contrast for readability. Stick to a simple colour palette and use intuitive associations. Avoid using too many colours or shades that blend data.
- Keep the quality of the visual (resolution for pixels vs vectorialisation) for the type of presentation (print vs screen).
Accessibility
- Colour vision: about 8% of men have a colour-vision deficiency - never encode information by colour alone (pair it with labels, shapes or patterns). Use a colourblind-safe palette such as Okabe-Ito and test your visuals with simulators (e.g. Viz Palette, Coblis or ColorBrewer).
- Contrast: text needs a contrast ratio of at least 4.5:1 with its background (3:1 for large text) (WCAG 2.2; check with the WebAIM contrast checker). Light grey on white fails.
- Size: check that the smallest text is readable at the real viewing distance - on an A3 poster seen from 1 m, nothing below about 12 pt.
- Alternative text: on screen and on the web, describe the image and its takeaway in one or two sentences for those who cannot see it.
Pixels vs vectors
Reference section - read it before exporting your visual.
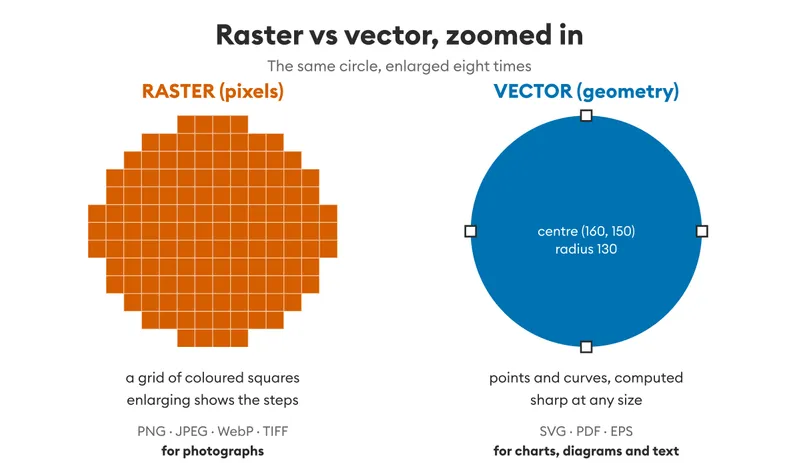
- Raster (bitmap): a grid of pixels, each with its own colour. Photos, screenshots, scanned documents. The resolution is fixed at capture/export: enlarging blurs the image (pixelation). Formats: PNG (lossless), JPEG (lossy, smaller), WebP, TIFF (archival/print).
- Vector: geometric shapes - points, curves, polygons - computed mathematically. Diagrams, charts, logos, text. Infinitely scalable without loss of quality. Formats: SVG, PDF, EPS, AI.
- Rule of thumb: vector for charts, diagrams and text; raster for photographs and organic textures. A chart should be exported as SVG/PDF, not as a JPEG.
- If you must export a raster (e.g. an image), export it at the final size or larger - never downscale and re-enlarge.
Resolution - screen vs print
- PPI (pixels per inch) describes screens, DPI (dots per inch) describes print. Same idea: density of information per inch.
- Screen: a nominal 72-150 PPI is enough for reading; but high-density displays (Retina and similar, 2x-3x) show roughly 220-460 PPI. Design images at 2x the nominal size to stay sharp on modern screens.
- Print: 300 DPI minimum for quality documents, magazines and posters seen from close. 150 DPI is acceptable for large formats viewed from a distance (posters, banners); 600 DPI and above only for very fine reproduction (art prints).
- Formula: pixels needed = target size (in inches) × DPI. Example: an A3 poster (≈16.5 × 11.7 in) at 300 DPI requires ≈ 4960 × 3508 px.
- What looks sharp on screen may print blurred: check the real pixel dimensions of your images before printing, don’t trust the preview.
Misleading visualisations
Visualisations can deceive - accidentally or on purpose:
- truncated axis - starting a bar chart above zero exaggerates differences (a line chart may start above zero, a bar chart may not) (Correll et al., 2020)
- lie factor - the size of the effect in the graphic should match the size of the effect in the data (Tufte, 2001)
- area for length - doubling both the width and the height of an icon quadruples its area, so the reader sees ×4 for a ×2
- dual axes - two scales on one chart let you make any two curves look correlated
- 3D effects - perspective makes the front slices of a pie look bigger than the back ones
- chartjunk - decoration that adds ink but no information
- cherry picking - choosing the scale, the window or the data that flatters the message
Be honest: an audience that catches a misleading chart will distrust the whole work (Huff, 1954; Cairo, 2016). This is the visual side of Ethical persuasion in the Rhetoric session.
Critiquing an AI-generated visual
Image generators produce attractive visuals quickly, but they make specific mistakes. Check every AI visual against this list:
- Text - garbled letters, invented words, misspelt labels.
- Data - numbers, proportions or scales that are invented or don’t match any source. An AI “chart” is often a picture of a chart, not a plot of data.
- Concepts - technically wrong diagrams: arrows in the wrong direction, components that don’t exist, impossible connections.
- Clarity - decoration that buries the message; no hierarchy; everything at the same level.
- Audience - does it suit laypersons, or does it look like a generic tech poster?
- Style - the generic “AI look” (glossy gradients, glowing circuits, floating holograms) weakens your ethos.
- Rights - can you use it? State the tool and the prompt, as required by the course’s rules on AI.
Your own visual can fail on the same points - apply the list to it too.
Tools
- Do not underestimate drawing by hand! Paper first, software second.
- Inkscape - professional vector graphics editor (SVG)
- GIMP - image editing and manipulation (raster)
- Krita - digital painting and illustration
- draw.io/diagrams.net - diagrams, flowcharts, technical drawings
- Veusz - scientific 2D/3D plotting
- Plotly - interactive visualizations (Python/R/JS)
- matplotlib + seaborn - Python visualization libraries
- ggplot2 - R visualization (based on Grammar of Graphics)
- Flourish - data storytelling (free tier available)
- DataWrapper - charts, maps, tables (free tier)
- Canva, MS PowerPoint, Google Slides, Adobe Illustrator - layout and infographics
Quick decision guide: which tool for what?
| Task | Recommended tool | Why |
|---|---|---|
| Simple chart (bar, line, pie) | DataWrapper, Flourish | No coding, fast, good defaults |
| Scientific plot with data analysis | Veusz, matplotlib+seaborn, ggplot2 | Full control, reproducible |
| Technical diagram/flowchart | draw.io, Inkscape | Precise, vector output |
| Infographic with storytelling | Canva (free), Inkscape | Design flexibility |
| Interactive visualization | Plotly | Web-ready, interactive |
| Photo/image editing | GIMP | Full-featured, free |
Resources
Visualisations can be supported by visual repositories:
- Photos: Unsplash / Pexels…
- Illustrations: Storyset / Smashicons / Iconscout…
- Icons: Flaticon / Google icons / Icones8…
- Fonts: Google Fonts / Fontshare / Bunny fonts…
- Colour palette: Colorhunt / Colormind
- Inspiration: Information is Beautiful / Dear Data / Gapminder (see also Hans Rosling’s talk - The best stats you’ve ever seen) / Example of infographics
EXERCISE - Makeover
In pairs (40 min):
- Take the visual provided in class - or find one about your assignment topic (documentation, product page, Wikipedia, press article).
- Critique (10 min): what is the message? Apply CARP, the ranking of encodings and the honesty checks. Note three strengths and three weaknesses.
- Redesign on paper (20 min): sketch at least two alternatives, then choose one. State any assumption you make about the data or the audience.
- Gallery walk (10 min): pin the sketches up, walk around, leave one constructive comment on each. Be considerate: the original designer had constraints you cannot see.
Visualising assignment
Create a visual on your own on the topic selected for the writing assignment. The audience are laypersons. Ask an AI to produce a similar visual. Compare and discuss pros and cons of both visuals (use the checklist above, for both). Suggest what you would do as a visual inspired from the previous ones and from your reflection. Chronologically report the entire process.
If your topic offers little data, accuracy applies to the concepts you show (e.g. how a message travels through the network): they must be technically right.
Suggested structure of the deliverable:
- Your visual (with its title, sources, your name and registration number)
- The AI visual, the tool used and the full prompt(s)
- The comparison: pros and cons of both
- Your proposal for an improved visual (a sketch is enough), and why
- The process, in chronological order, with short reflections
The format should be either a pdf or a jpeg, in a landscape or portrait format.
The first visual should be of quality in A3 format (≈16.5 × 11.7 in) - minimum 300 DPI if raster, or vector (SVG/PDF) to avoid resolution issues.
The clearer the better!
The file has to include your name and registration number at Cnam. Name the file USMC85_visualising-<registration number>-<Name> and submit it on Moodle, at the place and deadline of your master (see the Introduction for the evaluation rubric).
References
- Anscombe, F. J. (1973). Graphs in statistical analysis. The American Statistician, 27(1), 17-21.
- Bertin, J. (1967). Sémiologie graphique: Les diagrammes, les réseaux, les cartes. Gauthier-Villars. (English translation: Semiology of graphics, Esri Press, 2010)
- Cairo, A. (2016). The truthful art: Data, charts, and maps for communication. New Riders.
- Cleveland, W. S., & McGill, R. (1984). Graphical perception: Theory, experimentation, and application to the development of graphical methods. Journal of the American Statistical Association, 79(387), 531-554.
- Correll, M., Bertini, E., & Franconeri, S. (2020). Truncating the Y-axis: Threat or menace? Proceedings of the 2020 CHI Conference on Human Factors in Computing Systems, 1-8.
- Few, S. (2012). Show me the numbers: Designing tables and graphs to enlighten (2nd ed.). Analytics Press.
- Healey, C. G., & Enns, J. T. (2012). Attention and visual memory in visualization and computer graphics. IEEE Transactions on Visualization and Computer Graphics, 18(7), 1170-1188.
- Huff, D. (1954). How to lie with statistics. W. W. Norton.
- Knaflic, C. N. (2015). Storytelling with data: A data visualization guide for business professionals. Wiley.
- Kostelnick, C., & Roberts, D. D. (2011). Designing visual language: Strategies for professional communicators (2nd ed.). Longman.
- Lupi, G., & Posavec, S. (2016). Dear data. Princeton Architectural Press.
- Matejka, J., & Fitzmaurice, G. (2017). Same stats, different graphs: Generating datasets with varied appearance and identical statistics through simulated annealing. Proceedings of the 2017 CHI Conference on Human Factors in Computing Systems, 1290-1294.
- Munzner, T. (2014). Visualization analysis and design. CRC Press.
- Okabe, M., & Ito, K. (2008). Color universal design (CUD): How to make figures and presentations that are friendly to colorblind people.
- Tufte, E. R. (2001). The visual display of quantitative information (2nd ed.). Graphics Press.
- W3C. (2023). Web content accessibility guidelines (WCAG) 2.2.
- Ware, C. (2008). Visual thinking for design. Morgan Kaufmann.
- Wilke, C. O. (2019). Fundamentals of data visualization. O’Reilly.
- Williams, R. (2014). The non-designer’s design book (4th ed.). Peachpit Press.